
带你入门数据处理Chapter 1
带你入门数据处理Chapter 1
SarznChapter 1: A Comprehensive Guide to Data Analytics Foundations
Welcome to my first blog post on data analytics! *** - I studied in
Beijing Normal-Hong Kong Baptist University (BNBU). The school launched
a general education course (no matter what the major is), which includes
data processing, data analysis and machine learning。 - I think it will
be very helpful to everyone, so I will set up my own blog. Let’s learn
this course (actually it is used by me to review at the end of the
term)
I’ll break down key ideas, practical insights, and essential tools—all with key terms translated into Chinese for clarity. Let’s embark on this journey from data to actionable knowledge!
The Contents.
- Background
- Data Analytics Project Lifecycle(数据分析项目周期)
- Example of Data Analytics Project
- Project Understanding Phase
- Data Understanding Phase
- Data Format (数据格式)
- Data Types (数据类型)
- KNIME Lab (动手实践一下吧 ! )
- Lab: Workflow in KNIME (Data Import Export)
- Lab: Excel and CSV tables
- Review Questions
- APPENDIX: Introduction to KNIME
Background: The Bedrock of Data Science
AT first I will show you a image about “Top 10 high wage industries in China”(中国十大高薪行业)
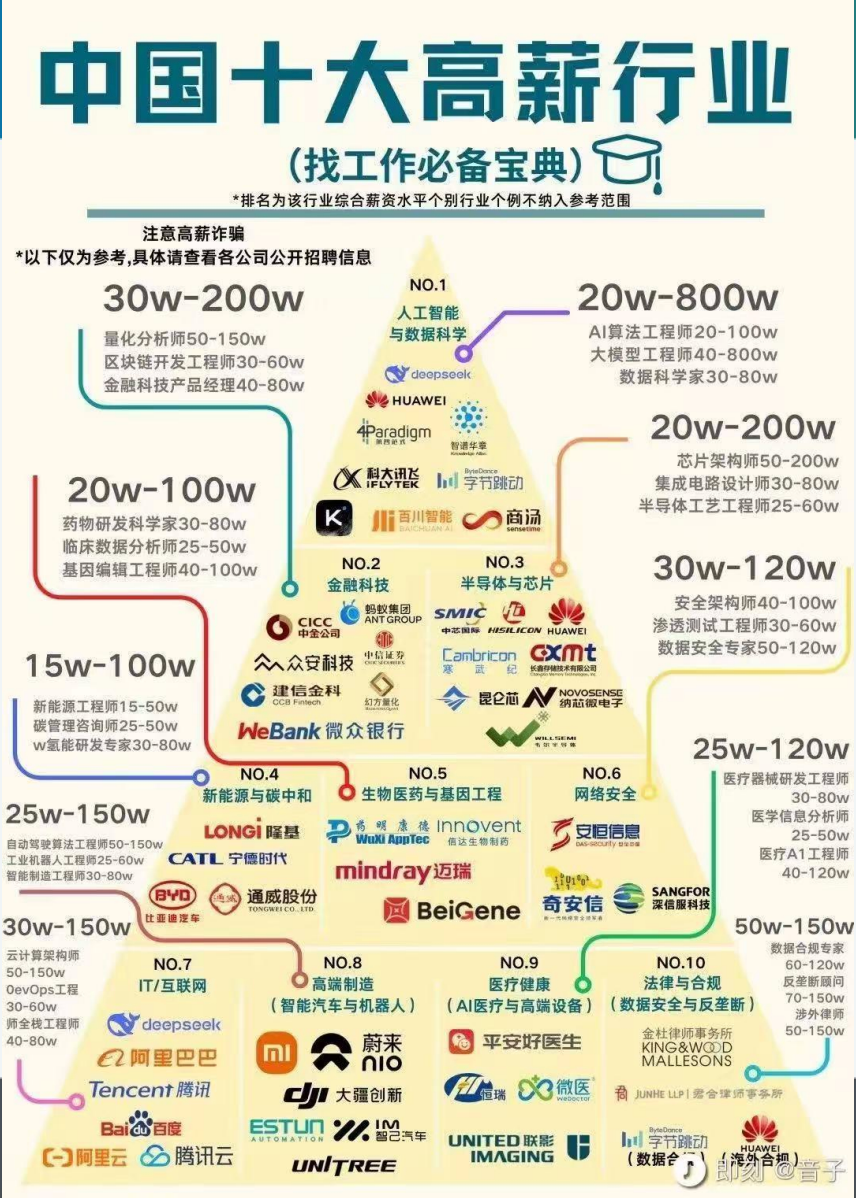 > In this picture, you
can see that most high paying jobs are related to data science
> In this picture, you
can see that most high paying jobs are related to data science
So a question belowed up “What is Data Science?” ### What is Data
Science? (数据科学) Data science (数据科学) is an interdisciplinary
field (交叉学科)that transforms raw data (数据) into
valuable knowledge (知识). It combines techniques from
mathematics, statistics, computer science, and domain expertise to
uncover patterns, make predictions, and drive decision-making. Unlike
isolated data points, knowledge derived from data science enables us to
forecast trends and solve complex problems.
>
数据科学是一门将原始数据转化为有价值知识的交叉学科领域。它融合了数学、统计学、计算机科学以及特定领域的专业知识,以揭示数据中的模式、进行预测并推动决策制定。与孤立的单个数据不同,通过数据科学获得的知识能够帮助我们预测趋势并解决复杂的问题。
From Data to Knowledge (从数据到知识)
The distinction between data and knowledge is crucial:
| Data | Knowledge |
|---|---|
| refer to single instances (single objects, people, events, points in time, etc.) | refers to classes of instances (sets of objects, people, events, points in time, etc.) |
| describe individual properties | describes general patterns,structures, laws, principles, etc. |
| are often available in large amount(databases, archives) | consists of as few statements as possible |
| are often easy to collect or to obtain (e.g., scanner cashiers insupermarkets, Internet) | is often difficult and time consuming to find or to obtain (e.g.,natural laws, education) |
| do not allow us to make predictions or forecasts | allows us to make predictions and forecasts |
- Data (数据): Refers to single instances (e.g., individual customer records, transaction details, or event timestamps). Data is abundant, easy to collect (e.g., supermarket scanner data, social media posts), but alone cannot support predictions.
- Knowledge (知识): Represents general patterns, structures, or principles derived from analyzing large sets of data. It is concise, hard to obtain (like natural laws or industry insights), and empowers forecasting.
Main Industries for Data Analytics (数据分析主要应用行业)
According to a 2018 KDnuggets poll, the top industries leveraging analytics (数据分析), data science (数据科学), and machine learning (机器学习) are: 1. CRM/Consumer analytics (客户关系管理/消费者分析) – 18.6% (No.1 for 5 consecutive years) 2. Health care (医疗保健) – 17.2% (jumped from No.4 to No.2) 3. Banking (银行业) – 17.0% 4. Finance (金融) – 16.1% 5. Science (科学研究) – 13.6%
Other notable fields include e-commerce (电子商务), education (教育), self-driving cars (自动驾驶汽车), and biotech (生物技术).
Some Data Science Roles in the Industry (行业内主要数据科学岗位)
The data science ecosystem comprises diverse roles, each with unique responsibilities: - Data Analyst (数据分析师): Analyzes data to answer business questions and generate reports. - (Big) Data Engineer (大数据工程师): Builds and maintains data pipelines and infrastructure. - Data Scientist (数据科学家): Designs and implements complex models to extract insights and predict outcomes. - Machine Learning Researcher (机器学习研究员): Develops advanced algorithms and models. - Data Science Manager/Director (数据科学经理/总监): Leads teams and aligns data initiatives with business goals. - Chief Data Officer (首席数据官): Oversees an organization’s data strategy and governance.
Data Science Skills (数据科学核心技能)
To thrive in data science, you need three core skill sets:
- Database & Coding Skills (数据库与编程技能): Proficiency in tools like Python, R, SQL, and Spark.
- Math, Statistics & Machine Learning Knowledge (数学、统计与机器学习知识): Foundations in probability, regression, classification, and model optimization.
- Domain/Business Expertise (领域/业务专长): Understanding the industry context to ask relevant questions and interpret results.
Data Analytics Project Lifecycle (数据分析项目生命周期)
A successful data analytics project follows a structured workflow, ensuring rigor and relevance from start to finish.
Process Flow of a data science project (数据科学项目流程)
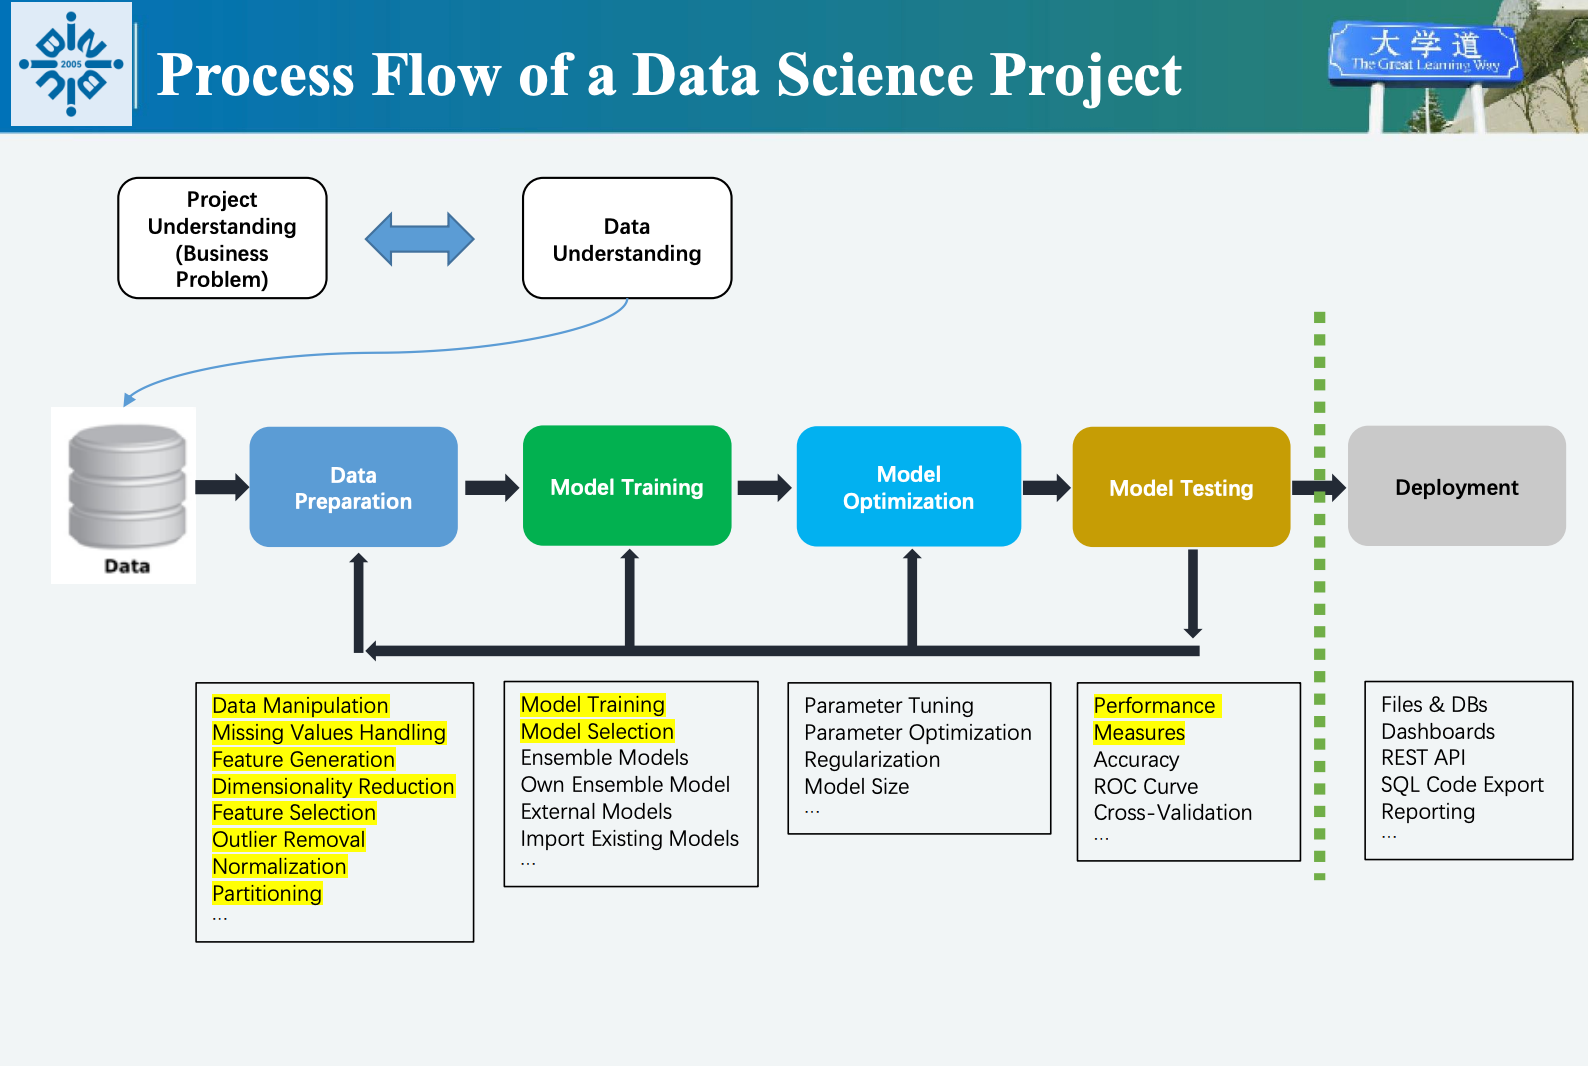 The lifecycle consists of
key phases: 1. Project Understanding (项目理解): Define
business problems and objectives. 2. Data Understanding
(数据理解): Explore and assess data quality. 3. Data
Preparation (数据准备): Clean, transform, and integrate data
(e.g., handling missing values, feature selection). 4. Model
Training(模型训练): Build models, and use ensemble techniques.
5. Model Optimization: Tune parameters. 6.
Model Testing (模型测试): Evaluate performance with
metrics like accuracy and cross-validation. 7. Model Deployment
(模型部署): Integrate models into real-world systems (e.g.,
dashboards, APIs).
The lifecycle consists of
key phases: 1. Project Understanding (项目理解): Define
business problems and objectives. 2. Data Understanding
(数据理解): Explore and assess data quality. 3. Data
Preparation (数据准备): Clean, transform, and integrate data
(e.g., handling missing values, feature selection). 4. Model
Training(模型训练): Build models, and use ensemble techniques.
5. Model Optimization: Tune parameters. 6.
Model Testing (模型测试): Evaluate performance with
metrics like accuracy and cross-validation. 7. Model Deployment
(模型部署): Integrate models into real-world systems (e.g.,
dashboards, APIs).
Example Data Analytics Projects (数据分析项目案例)
Data analytics solves diverse business challenges. Here are key examples: - Customer Segmentation (客户细分): Group customers by purchase behavior to design targeted marketing campaigns (e.g., offering discounts based on basket size). - Risk Assessment (风险评估): Predict loan repayment probability or credit risk using customer history. - Taxi Demand Prediction (出租车需求预测): Forecast how many taxis are needed in a city at specific times (e.g., NYC at noon on Wednesdays). - Recommendation Engines (推荐引擎): Suggest products to customers based on past purchases (e.g., “People who bought X also liked Y”). - Fraud Detection (欺诈检测): Identify suspicious transactions to prevent financial loss. - Sentiment Analysis (情感分析): Analyze customer reviews to gauge opinions about products/services.
Project Understanding: What Are Cognitive Maps Used For? (认知地图的用途)
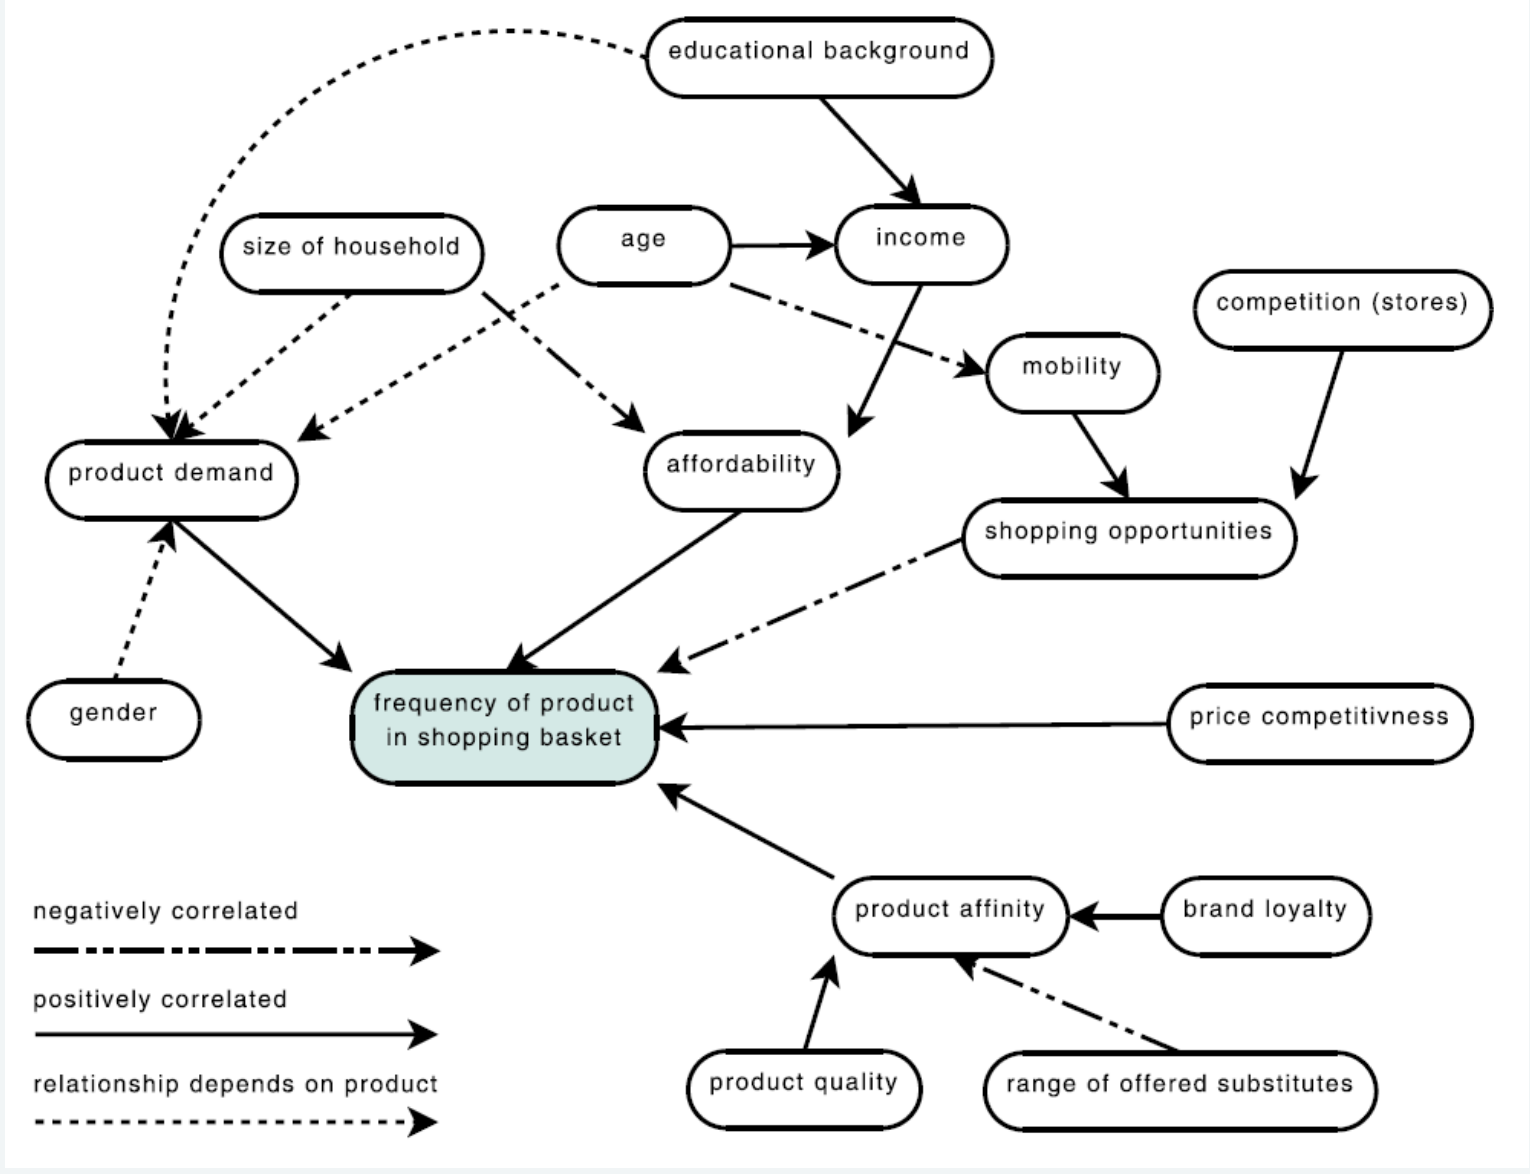 Cognitive Maps
(认知地图) are visual tools used in the project understanding
phase to: - Map relationships between factors (e.g., age, income,
product demand, and competition). - Highlight direct/indirect influences
(e.g., household size indirectly affects product affordability). -
Identify positive/negative correlations (e.g., price competitiveness
negatively correlates with brand loyalty). - Align stakeholders on key
variables and their interactions, reducing miscommunication between
project owners and analysts.
Cognitive Maps
(认知地图) are visual tools used in the project understanding
phase to: - Map relationships between factors (e.g., age, income,
product demand, and competition). - Highlight direct/indirect influences
(e.g., household size indirectly affects product affordability). -
Identify positive/negative correlations (e.g., price competitiveness
negatively correlates with brand loyalty). - Align stakeholders on key
variables and their interactions, reducing miscommunication between
project owners and analysts.
Data Understanding: 3 Problems with Raw Data (原始数据的三大问题)
Raw data is rarely ready for analysis. Common challenges include: 1. Data Integration Issues (数据整合问题): Data comes from diverse sources (flat files, databases, Excel spreadsheets) with missing or non-unique IDs, making integration cumbersome. 2. Poor Data Quality (数据质量问题): Errors like incorrect values (e.g., “2090” for birth year), missing entries (e.g., default birthdates set to 1970), or inconsistent formats. 3. Privacy Concerns (隐私问题): Sensitive data may be scattered across locations, requiring compliance with regulations (e.g., GDPR) to protect confidentiality.
The 80% Rule Over 80% of data analysts’ time is spent on loading and cleaning data.
Data Format (数据格式)
Data is categorized into structured and unstructured formats, each with unique properties. ### Structured vs. Unstructured Data (结构化数据 vs. 非结构化数据) - Structured Data (结构化数据): Organized in a predefined format (e.g., tables, databases) with clear attributes and relationships. It is machine-readable and easy to analyze. - Unstructured Data (非结构化数据): Lacks a fixed format and includes text, images, audio, social media posts, or customer reviews. It requires processing to extract insights.
Examples (示例)

| Category (类别) | Examples (示例) |
|---|---|
| Structured Data (结构化数据) | CSV files, Excel spreadsheets, JSON/XML records, SQL databases |
| Unstructured Data (非结构化数据) | Social media posts, customer reviews, emails, audio transcripts, book texts (e.g., Pride and Prejudice) |
“Thomas said: For our course, we’ll have our final exam on 9:30, 6/December. The exam will last 2 hours, place will be T7-501. Please revise carefully.”
Be structure { ”date”: 06/12/2021 “time”: 09:30 “duration”: 120 “event”: “final exam” “type”: “closed book” “place”: “T7-501” “course code”: “GFQR1013” “course name”: “Hands on Data Analytics” “lecturer”: “Justin Zhang” }
In the following article, I will introduce several commonly used structured data types.
There are - Comma-separated values (CSV) - Extensible Markup
Language (XML) - JavaScript Object Notation (JSON) -
Microsoft Excel (XLS)
(The other thing i gonna repair later)
Properties of CSV Format (CSV格式特性)
Comma-Separated Values (CSV, 逗号分隔值) is a widely
used structured format: - Delimits values with commas (or
semicolons/TABs in regions using commas as decimal separators). - Each
line represents a data record; each record contains multiple attributes.
- Supports plain text storage of tabular data (表格数据)(numbers and
text). - Fields with embedded commas or quotes must be enclosed in
double quotes (e.g., "Super, ""luxurious"" truck"). -
Compatible with almost all spreadsheets (Excel) and programming
libraries.
For example:I wanna Save a table like this in a CSV file ->
| Year | Make | Model | Description | Price |
|---|---|---|---|---|
| 1997 | Ford | E350 | ac, abs, moon | 3000.00 |
| 1999 | Chevy | Venture “Extended Edition” | 4900.00 | |
| 1999 | Chevy | Venture “Extended Edition, Very Large” | 5000.00 | |
| 1996 | Jeep | Grand Cherokee | MUST SELL! air, moon roof, loaded | 4799.00 |
2 条 CSV 核心基础规则 这是理解该字段的前提,所有 CSV 工具(Excel、Pandas、记事本)都遵循这两条规则: 1:字段包裹规则 当字段包含「特殊字符」(
逗号 ,、双引号 "、换行符 \n)时,必须用一对双引号 " "将整个字段包裹起来,用于标识「这个字段的开始和结束」,避免工具误解析特殊字符 2:双引号转义规则 当字段内部本身需要包含双引号 ” 时,不能直接写单个 “(会被误认为是字段的结束符),必须用两个连续的双引号”” 来「转义表示一个实际的双引号 “」,这是 CSV 中唯一的双引号转义方式
The CSV moudle is 1
2
3
4
5Year,Make,Model,Description,Price
1997,Ford,E350,"ac, abs, moon",3000.00
1999,Chevy,"Venture ""Extended Edition""",,4900.00
1999,Chevy,"Venture ""Extended Edition, Very Large""",,5000.00
1996,Jeep,Grand Cherokee,"MUST SELL! air, moon roof, loaded",4799.00"Venture ""Extended Edition""",
我们把这个字段拆成6个部分,逐一对应解释: | 字段片段 | 含义与作用 |
对应原始文本 | | :——- | :——— | :———– | | "(开头) |
外层字段包裹符,标识「这个CSV字段的开始」 | - | | Venture |
普通文本内容,无特殊字符,直接保留 | Venture | |
"" | 双引号转义,代表1个实际的英文双引号 " |
"(原始文本中包裹Extended Edition的左引号) |
| Extended Edition | 普通文本内容,无特殊字符,直接保留 |
Extended Edition | | "" |
再次双引号转义,代表1个实际的英文双引号 " |
"(原始文本中包裹Extended Edition的右引号) |
| "(结尾) | 外层字段包裹符,标识「这个CSV字段的结束」 | -
| | ,(字段后) |
CSV的列分隔符,标识当前字段结束,切换到下一列 | - |
Properties of JSON Format (JSON格式特性)
Because HTTP is a protocol for transferring text, the data you request through a web API needs to be serialized into a string format. Often this serialization uses JavaScript Object Notation (JSON). This data format makes their string representations easy to interpre. >由于 HTTP 是一种用于传输文本的协议,你通过 Web API 请求的数据需要被序列化为字符串格式。这种序列化通常使用 JavaScript 对象表示法(JSON)。这种数据格式使其字符串表示形式易于解析 > > 因此,在网络上传输复杂数据(如对象、数组)时,必须先将其序列化(转换)为字符串 > > 这也是前后端分离架构、微服务通信、移动应用与服务器交互等场景的基础
JavaScript Object Notation (JSON,
JavaScript对象表示法) is ideal for web APIs and data exchange:
- Uses key-value pairs (e.g., "author": "Joel Grus") for
human-readable serialization. - Supports nested structures (e.g., arrays
of topics or chapters). - Lightweight and easy to parse with most
programming languages. - Commonly used to transfer data between web
servers and applications.
A piece of JSON code
1 | { |
Data Types (数据类型)
Data attributes are classified by their scale type, which determines how they can be analyzed.
Data Table: Attributes and Instances (数据表:属性与实例)
- Attributes (属性): Columns in a table (e.g., age, gender, blood pressure) – also called features or variables.
- Instances (实例): Rows in a table (e.g., individual customer or patient records) – also called records or data objects.
Example table: | No | Sex (属性:性别) | Age (属性:年龄) | Blood Pr. (属性:血压) | Height (属性:身高) | |—-|——————|——————|————————|———————| | 1 | male (实例1:男性) | 20 (实例1:20岁) | normal (实例1:正常) | 175.0 (实例1:175.0cm) | | 2 | female (实例2:女性) | 73 (实例2:73岁) | normal (实例2:正常) | 172.2 (实例2:172.2cm) |
Recognizing Data Types (识别数据类型)
There are four key data types, each with distinct characteristics: 1. Categorical/Nominal (分类/名义型): - Finite, unordered values (e.g., gender: male/female; drug type: A/B). - No inherent ranking (e.g., “A” is not better than “B”). - May have hierarchical structures (e.g., “drinks” → “water/beer/wine”).
- Ordinal (有序型):
- Values with a linear order but no fixed distance between them (e.g., blood pressure: low/normal/high; education: bachelor’s/master’s/Ph.D.).
- Ranking matters, but differences are not quantifiable.
- Numeric Continuous (数值型-连续):
- Real-number values that can take any value within a range (e.g., height: 175.0cm; weight: 68.5kg).
- Requires handling precision and rounding.
- Numeric Discrete (数值型-离散):
- Integer values that represent counts (e.g., age: 20; number of purchases: 5).
- Cannot take fractional values (e.g., you can’t have 2.5 purchases).
KNIME Software (KNIME软件)
KNIME (Konstanz Information Miner) is an open-source tool for data analytics, known for its visual workflow interface.
Nodes and Edges in KNIME (KNIME中的节点与边)
- Nodes (节点): Represent specific tasks or operations (e.g., data import, cleaning, model training). Each node has configurable parameters.
- Edges (Arrows) (边/箭头): Indicate the flow of data between nodes. They connect input data to processing steps and output results.
Meanings of Node Lights (节点指示灯含义)
Each node displays a colored light to indicate its status: - Green Light (绿灯): The node is configured correctly and has successfully executed. - Orange Light (橙灯): The node has a warning (e.g., minor configuration issues that don’t prevent execution). - Red Light (红灯): The node has an error (e.g., invalid parameters, missing data) and cannot execute.
That wraps up Chapter 1! These foundational concepts lay the groundwork for practical data analytics. Whether you’re a beginner or looking to refresh your knowledge, understanding these basics is key to tackling real-world projects. Stay tuned for more deep dives into tools, advanced techniques, and case studies!
Let me know your thoughts or questions in the comments below. Happy analyzing! 📊